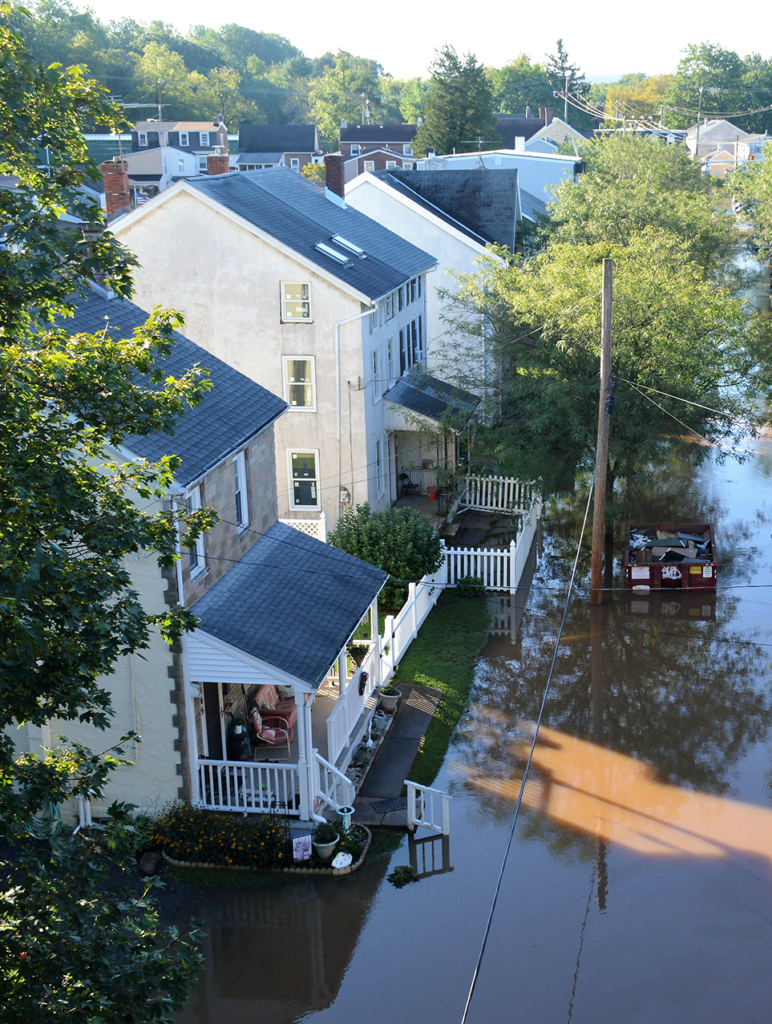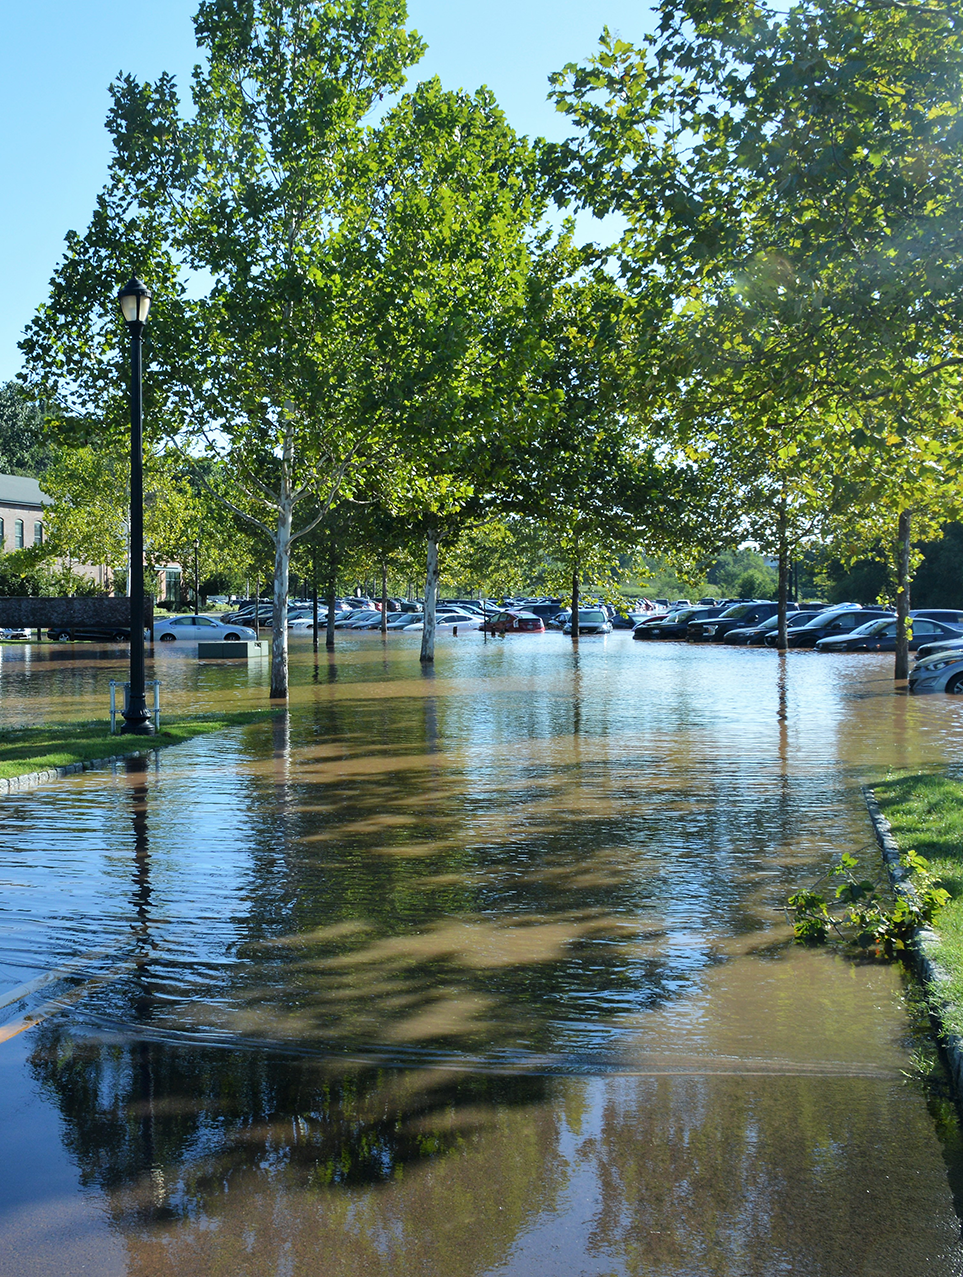
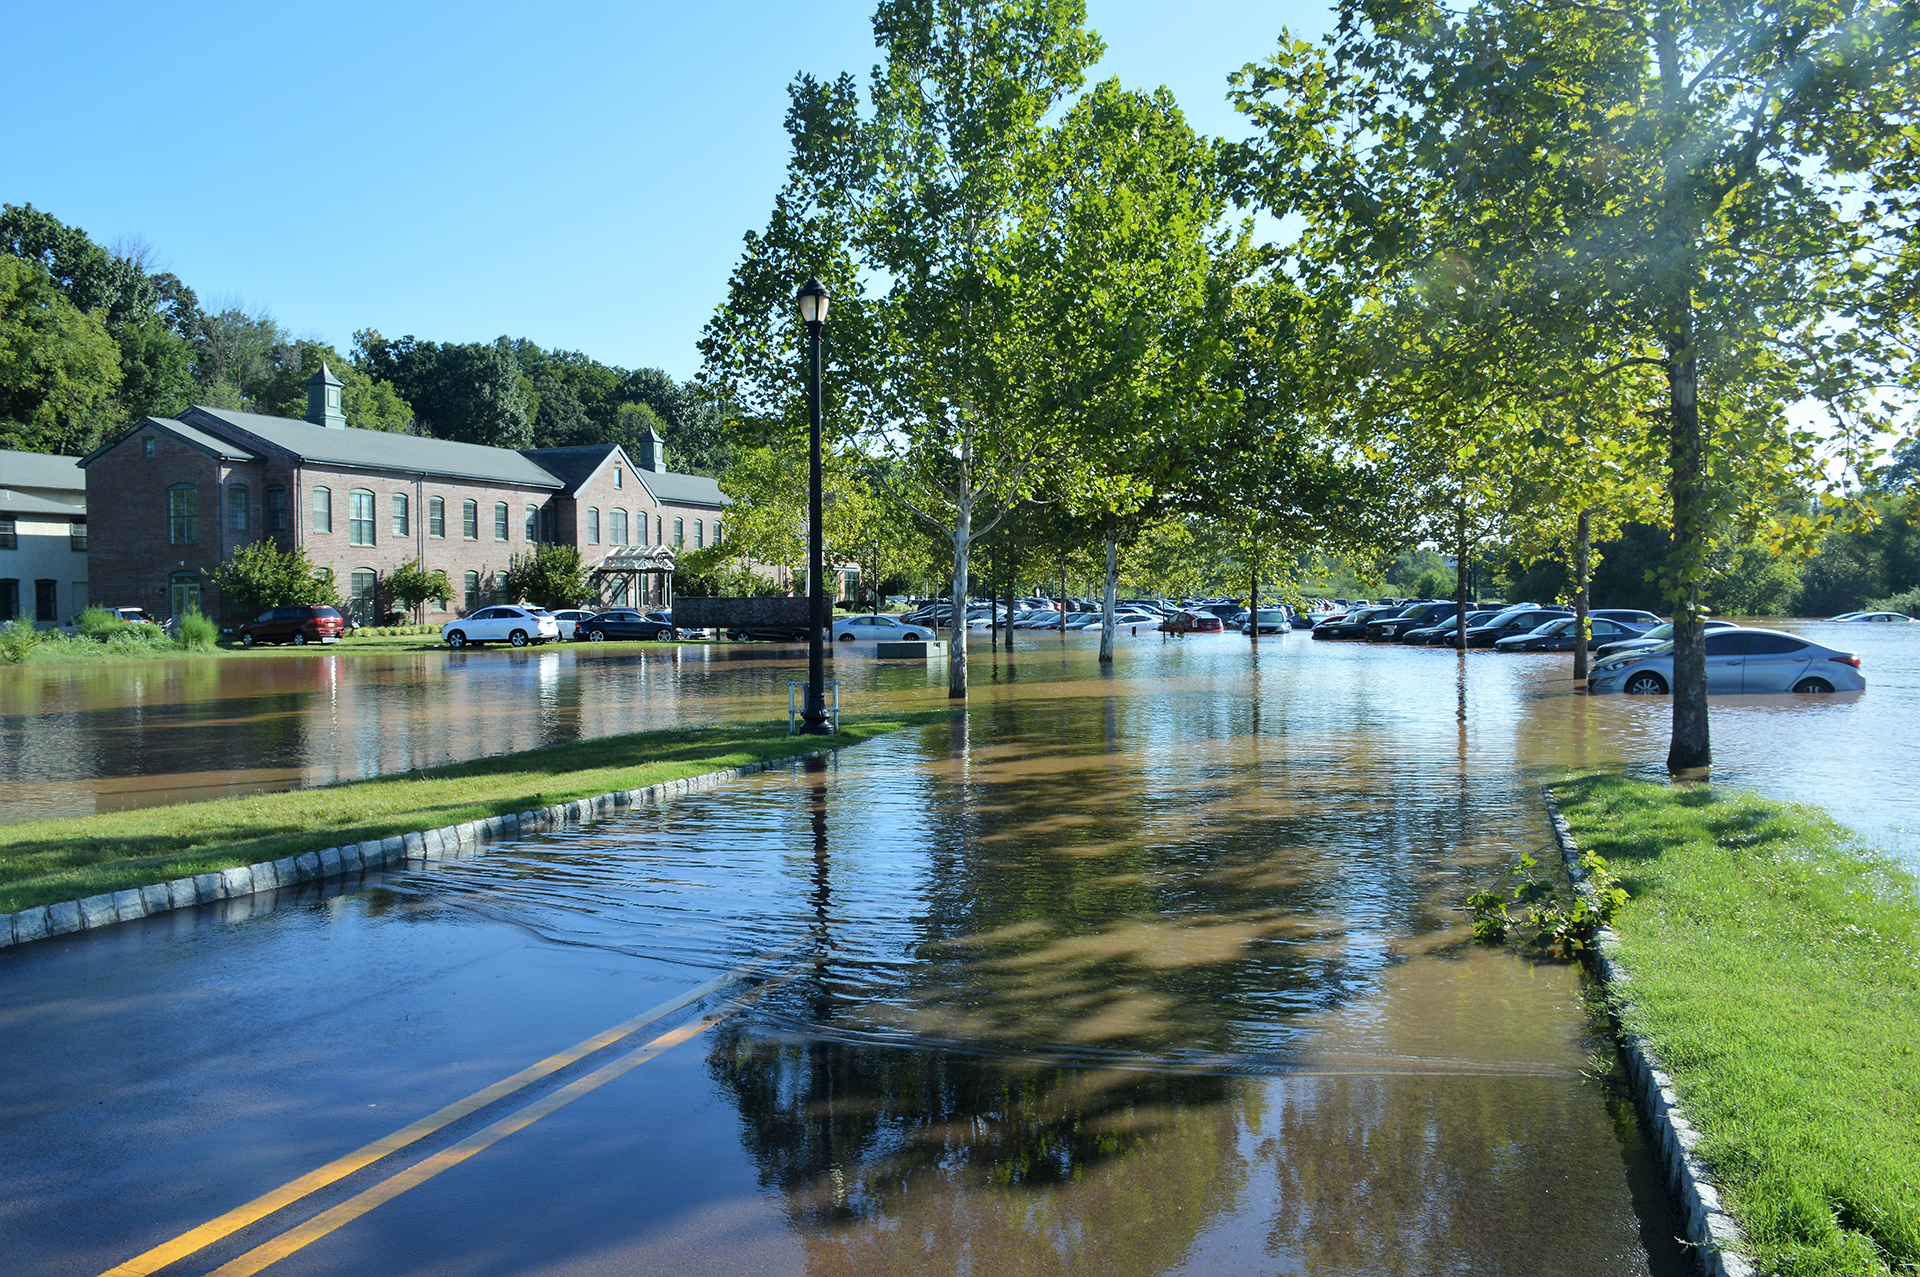
In early September 2021, the remnants of Hurricane Ida swept through Southeastern Pennsylvania, destroying hundreds of homes, resulting in more than a hundred million dollars in economic damages and killing five people. Much of the pain was felt within the Schuyl-kill River watershed, where Ida left homes and businesses flooded from Schwenksville to Norristown to Philadelphia. Analysis by the Philadelphia Water Department (PWD) later determined that, based on 20th century rainfall data, the river’s flooding under Ida was the kind of event you’d expect to see once every 65 years or so — once in a lifetime.
But this is not your grandfather’s Southeastern Pennsylvania. As climate change has intensified, the region has experienced more extreme precipitation. Recent analysis by PWD of rainfall data from the past two decades shows that Ida-level flooding along the Schuylkill is now more like a once-every-30-year event.
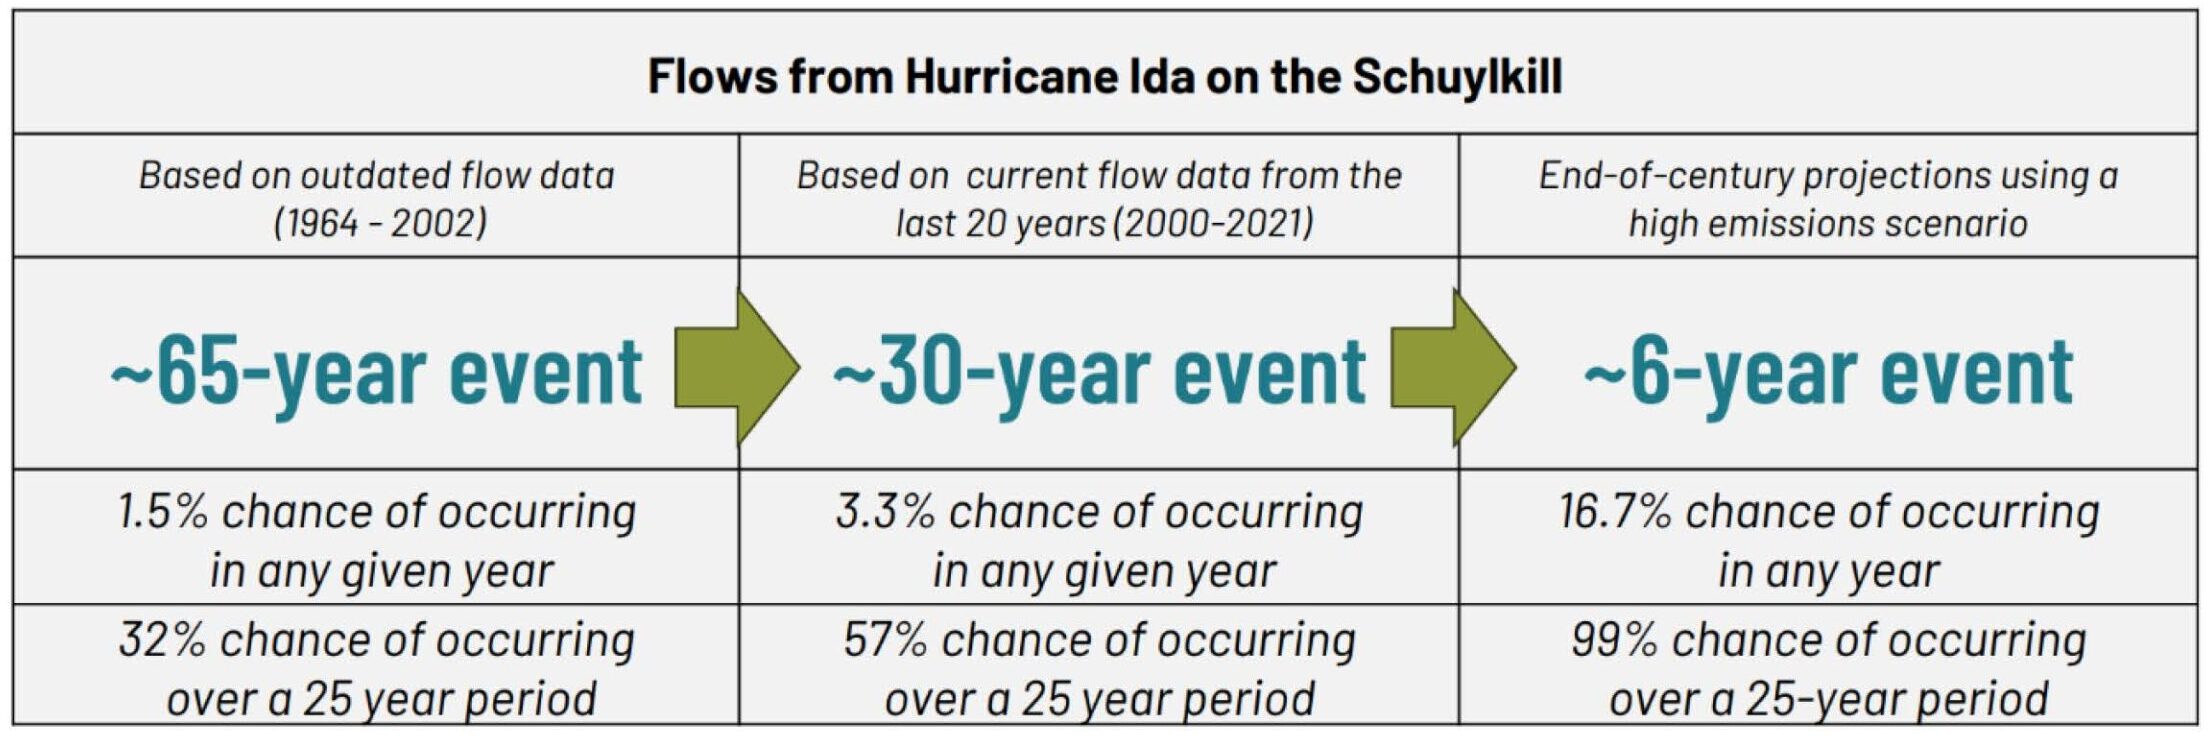
Then comes the real kicker: PWD calculated that, if our planet follows a high greenhouse gas emission scenario, such flooding could become a once-every-six-years proposition by the end of the century.
PWD’s forward-looking modeling efforts are important. Unfortunately, they are uncommon. Many engineers across the country designing infrastructure that could last for decades, if not centuries, are still relying on a pre-global warming paradigm that usually assumes precipitation patterns will remain static.
Some agencies, such as the National Oceanic and Atmospheric Administration (NOAA), are trying to turn the ship.
Holding up the skies
In Greek mythology, the titan Atlas is sentenced by Zeus to forever hold up the heavens. Now, it’s NOAA’s Atlas program tasked with protecting us from crashing skies.
The program launched in the middle of the 20th century, when the United States went on a New Deal infrastructure spree of dam and highway construction. Engineers of many stripes suddenly needed to know: Just how much rainfall should they design such massive projects for?
“The federal agencies were looking for authoritative datasets to help inform the design of civil engineering infrastructure,” says Fernando Salas, director of the Geo-Intelligence Division of NOAA’s Office of Water Prediction. The Environmental Science Services Administration’s (now NOAA) Weather Bureau (now the National Weather Service) was selected.
In the decades since, the Atlas program has dependably delivered 14 volumes of national precipitation data, now considered a gold standard. Engineers across the country use the data to understand just how much the clouds overhead can open up — critical information in designing everything from a storm inlet in the Florida Keys to a nuclear power plant in Washington State.
Historically, Atlas has relied on past precipitation data, but climate change increasing the frequency and intensity of extreme rainfall is throwing water on that approach.
Enter another crucial chapter for America’s built environment: the Bipartisan Infrastructure Law. Passed in 2022, the law set aside some $30 million to support a fundamental shift in the Atlas program. While Atlas previously generated updated rainfall data only when a state asked and paid for it, the new funding supports a comprehensive, nationwide update free of charge to states. Crucially, the update, named Atlas 15, will also incorporate climate change for the first time, Salas says.
It’s a huge effort, trying to adjust what we think the precipitation will look like over mountain ranges, or in low-lying areas, or wherever.”
— Fernando Salas, NOAA Office of Water Prediction
But the science isn’t easy. Modeling under Atlas was already a challenge, as program staff had to wrangle and organize massive amounts of precipitation data while also considering geospatial variables like elevation to calculate precipitation estimates even in places far away from the nearest weather station.
“It’s a huge effort,” Salas says. “Trying to adjust what we think the precipitation will look like over mountain ranges, or in low-lying areas, or wherever.”
Now, the challenge is layering on climate change decades into the future, an inherently uncertain exercise. To do so, Salas says NOAA relied on international climate models like those developed by the United Nations Intergovernmental Panel on Climate Change (IPCC), which can help predict changes in extreme rainfall. Because such models vary greatly between best- and worst-case scenarios and come with different degrees of scientific uncertainty, Atlas 15 will provide engineers with a kind of choose-your-own adventure interface as it rolls out over the next few years.
“One could look at projections as a function of global warming level. So, ‘Hey, I’m assuming it’s going to be two degrees [warmer] by 2070,’ and then you can pull up those values,” Salas says, adding that engineers can also choose other models and timespans, “depending on the life of the particular piece of infrastructure they’re building.”
Learning to adapt
Although NOAA is on the cusp of delivering game-changing precipitation models, it will be up to the nation’s engineers to use it. That presents a whole other challenge, says Lauren McPhillips, a professor of civil and environmental engineering at Pennsylvania State University.
Nationally, many engineers rely on the guidance of organizations like the American Society of Civil Engineers (ASCE). McPhillips says such organizations are largely taking climate change seriously and “really trying to push it forward.” But they’re fighting against decades of professional inertia.
A major challenge is that engineers employed by state and local governments are often bound to regulations created by pertinent legislative bodies. That can create political difficulties, as engineering to newer, more demanding precipitation standards can cost more. There’s also the hurdle of culture change, as older engineers may simply feel less comfortable in applying newer methods, which prompts McPhillips to place a premium on the education of the next generation of engineers.
Climate change isn’t waiting around for such professional turnover, but McPhillips says that in Pennsylvania, there is some near-term promise. The Pennsylvania Department of Environmental Protection (DEP) maintains a guidance for stormwater management that she says is regularly used to inform the engineering of new construction projects. The DEP is working on an update to the manual for the first time in nearly 20 years, and McPhillips says a draft currently instructs engineers to use the 90th percentile extreme rain event, as opposed to a median figure used previously.
Even before the release of Atlas 15, the change would effectively prod engineers to account for a changing climate with more intense rainfalls.
“It’s still not taking climate models and more precise values,” McPhillips says, “but it’s providing some safety factors pushing design to a higher level.”
In Philadelphia, Abby Sullivan, chief resilience officer for the Office of Sustainability (OOS), says there are also some proactive actions being taken. At the moment, there is no blanket requirement for City agencies to use a climate-conscious precipitation model, which often results in the current Atlas 14 models being the default. However, some agencies have endeavored to do more, particularly PWD, which leveraged outside consultant CDM Smith to develop its own, localized, forward-looking precipitation models when designing infrastructure.
Sullivan adds that OOS is also working to provide better information to other departments. In one instance, the office purchased access to models from the First Street Foundation, a national nonprofit that develops climate-sensitive data it says is more accurate than current federal counterparts. The models have taken some heat, and are not typically as accurate as hyperlocal efforts like those made by PWD, but Sullivan says they can be used to demonstrate current and future risks not identified by standard tools.
At the moment, Sullivan says she’s not even sure a city-wide, “prescriptive” regulatory approach is the right way to go. Decisions might naturally vary case-to-case, such as with one engineer who’s building a road that can be allowed to flood, while another is building a critical sewer pipe that should never go underwater.
“We’re trying to have more geospatial tools, have one place where people can see, what are the sea level rise projections? Where’s flooding going to be? Things that people can toggle on and off,” Sullivan says. “But we’re not there yet.”
![]() This content is a part of Every Voice, Every Vote, a collaborative project managed by The Lenfest Institute for Journalism. Lead support for Every Voice, Every Vote in 2024 and 2025 is provided by the William Penn Foundation with additional funding from The Lenfest Institute for Journalism, Comcast NBC Universal, The John S. and James L. Knight Foundation, Henry L. Kimelman Family Foundation, Judy and Peter Leone, Arctos Foundation, Wyncote Foundation, 25th Century Foundation, and Dolfinger-McMahon Foundation. To learn more about the project and view a full list of supporters, visit www.everyvoice-everyvote.org. Editorial content is created independently of the project’s donors.
This content is a part of Every Voice, Every Vote, a collaborative project managed by The Lenfest Institute for Journalism. Lead support for Every Voice, Every Vote in 2024 and 2025 is provided by the William Penn Foundation with additional funding from The Lenfest Institute for Journalism, Comcast NBC Universal, The John S. and James L. Knight Foundation, Henry L. Kimelman Family Foundation, Judy and Peter Leone, Arctos Foundation, Wyncote Foundation, 25th Century Foundation, and Dolfinger-McMahon Foundation. To learn more about the project and view a full list of supporters, visit www.everyvoice-everyvote.org. Editorial content is created independently of the project’s donors.